
 Contact
 How to shop

Delivery
Shopping guide
 English
 65 b
Up to 30 days for returns
Customers also purchased









 /
 Hardback
 27.53
€















 /
Paperback
51.44
€
 /
Paperback
24.91
€






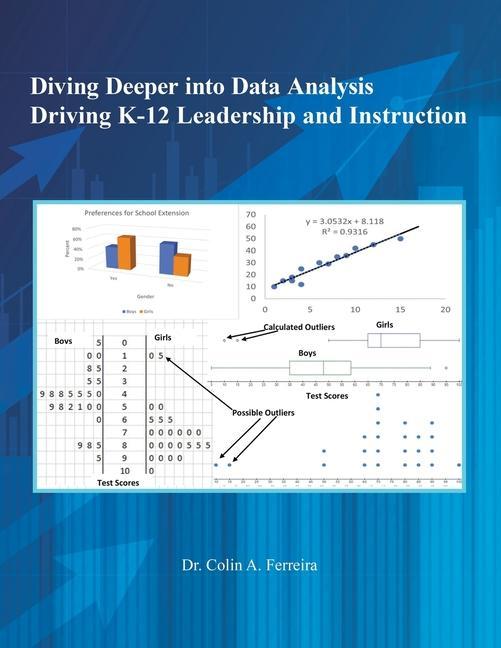
This textbook demystifies the complex Statistical calculations and difficulty in analyzing and interpreting assessment data by presenting simplified approaches for:
• Understanding data types and using appropriate graphical and numerical forms to describe data.
• Correctly reading and interpreting quantitative data and qualitative data presented in charts, tables, and graphs including pie charts, bar graphs, two-way tables, side-by-side bar graphs, segmented bar graphs, line graphs, histograms, dotplots, parallel boxplots, side-by-side stemplots, and scatter plots.
• Correctly reading and interpreting quantitative data presented in numerical forms including mean, median, standard deviation, range, interquartile range, percentiles, quartiles, and standardized scores (z-scores).
• Making data-driven decisions based on statistical calculations and interpretations.
• Using the results of prudent data analysis to drive leadership and instruction.
• Using the findings of extensive data analysis of assessment data to develop an innovative school improvement action plan.


About the book
English
Categories

Give this book today
It's easy
1 Add to cart and choose Deliver as present at the checkout 2 We'll send you a voucher 3 The book will arrive at the recipient's addressYou might also be interested in










 /
Paperback
49.03
€














Hi! I'm Libroamiko, your book advisor.
How can I help you?